Roasting Notes: September 2025
First month of written roasting notes. These are the working notes from the roaster rather than a finished argument.
This month: holding the standard profile
Most of September went into consistency rather than experiment. The profile is settled; the work is executing it the same way twice.
The standard profile
- 14-17 minute total roast time
- Charge temperature around 150-160°C
- First crack around the 12 to 14 minute mark, median 199°C
- Development around 20% of total roast, most batches 15-23%
- Drop temperature 210-220°C for a standard batch
Running one profile across most origins rather than tuning per lot has some specific advantages. Consistent development makes it easier to taste what the coffee itself is doing. Predictable timing makes production planning tractable. And when a batch goes wrong there are fewer variables to check.
Where it works and where it doesn’t
The standard profile covers about 90% of what we roast. The exceptions are recognisable in advance.
Works as-is:
- Most Central and South American coffees
- Washed processing
- Medium-density beans
Needs adjustment:
- Very dense, high-altitude coffees, which may need longer development
- Natural process coffees, which often work better with shorter development
- Roast levels well outside our normal band
- Experimental processing
One excellent standard profile plus the flexibility to deviate for the remaining 10% has served us better than optimising every roast individually.
Stopping before second crack
The profile stops just short of second crack, which begins around 225°C. Drop temperatures of 210-215°C sit below that: developed enough for sweetness, short of the point where roast character starts covering the origin.
What the logs show
Looking back at the older data from the period when we were still settling the profile:
Summer 2022:
- Total time 17:13, development 13.9%
- Total time 16:10, development 13.2%
- First crack at 200.3°C and 202.6°C
- Drop temperatures of 209.0°C and 212.3°C
Those two batches sit at the light end of what we do. Measured across every roast in the logs the median development ratio is closer to 20%, so the tight 13-15% figure we used to quote came from reading too few curves.
Roast curves
We’ve started publishing the temperature curves out of RoasTime rather than describing them.
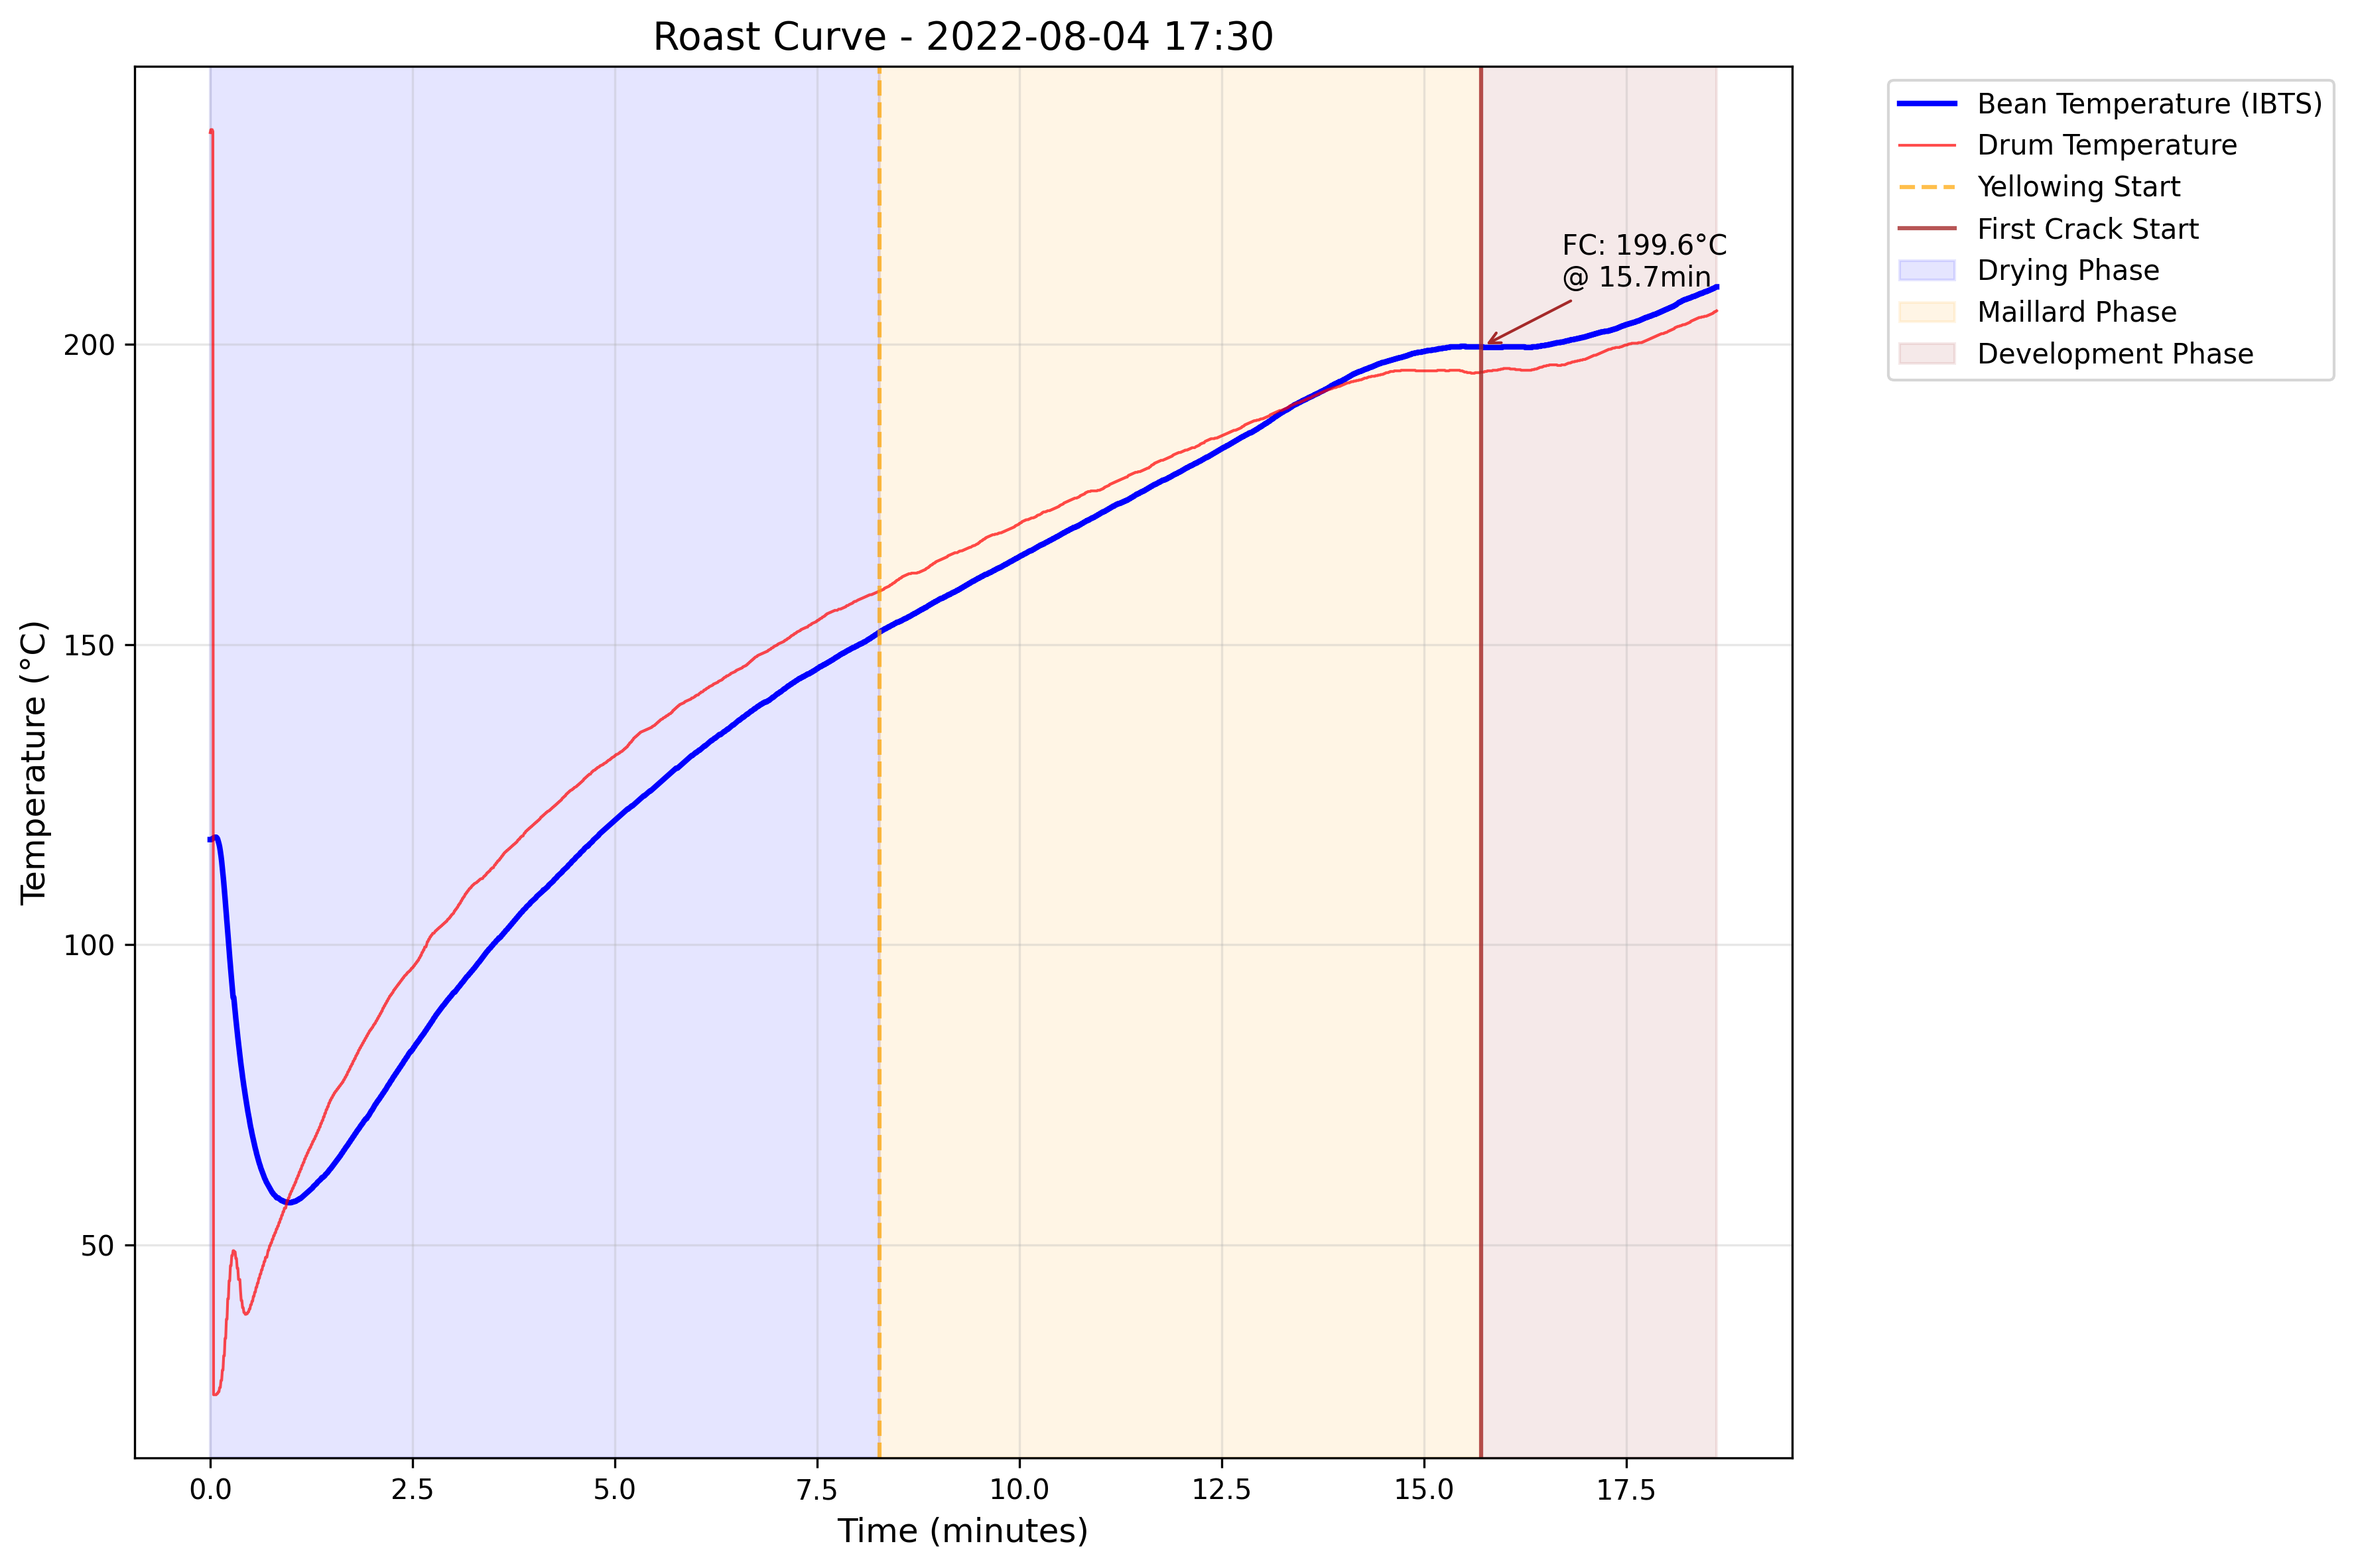
Roast curve showing the three phases: drying (blue), Maillard (orange), and development (brown)
- Drying: first 8 minutes, steady climb as moisture leaves the bean
- Maillard: minutes 8-14, where flavour compounds develop
- Development: final 4 minutes after first crack
Longer version, with what to listen and look for in each phase: Understanding Coffee Roast Phases.
Equipment
The Aillio Bullet R1 does all of it. This month’s work on the setup:
- RoasTime integration. Every roast logged with its temperature curve.
- Plotting. Python scripts parse the RoasTime data and generate the curve images.
- Phase documentation. Drying, Maillard, and development marked per batch.
- Environmental logging. Ambient temperature and humidity, which move the profile more than you’d expect.
The Bullet’s bean temperature probe (IBTS) is the reason any of this is possible. Publishing the actual curves rather than talking about them in the abstract has changed how we explain the process.
October
Expected next month:
- New crop Peru from a different farm in the Colasay region
- An Ethiopian natural
- Profile adjustments as the weather cools
For other roasters
Takeaways from the month:
- Build one good standard profile first. Consistency before complexity.
- Spend the attention on green selection. Good beans on a solid standard roast beat mediocre beans on a tuned one.
- Know when to deviate, and keep it the exception.
Questions about any of this? Coffee roasting discussion always welcome