Understanding Coffee Roast Phases
A roast moves green coffee through several distinct stages, and what separates a good batch from a bad one is mostly how long it spends in each. These are the curves off our Aillio Bullet R1, with what happens in each phase.
The complete roast curve
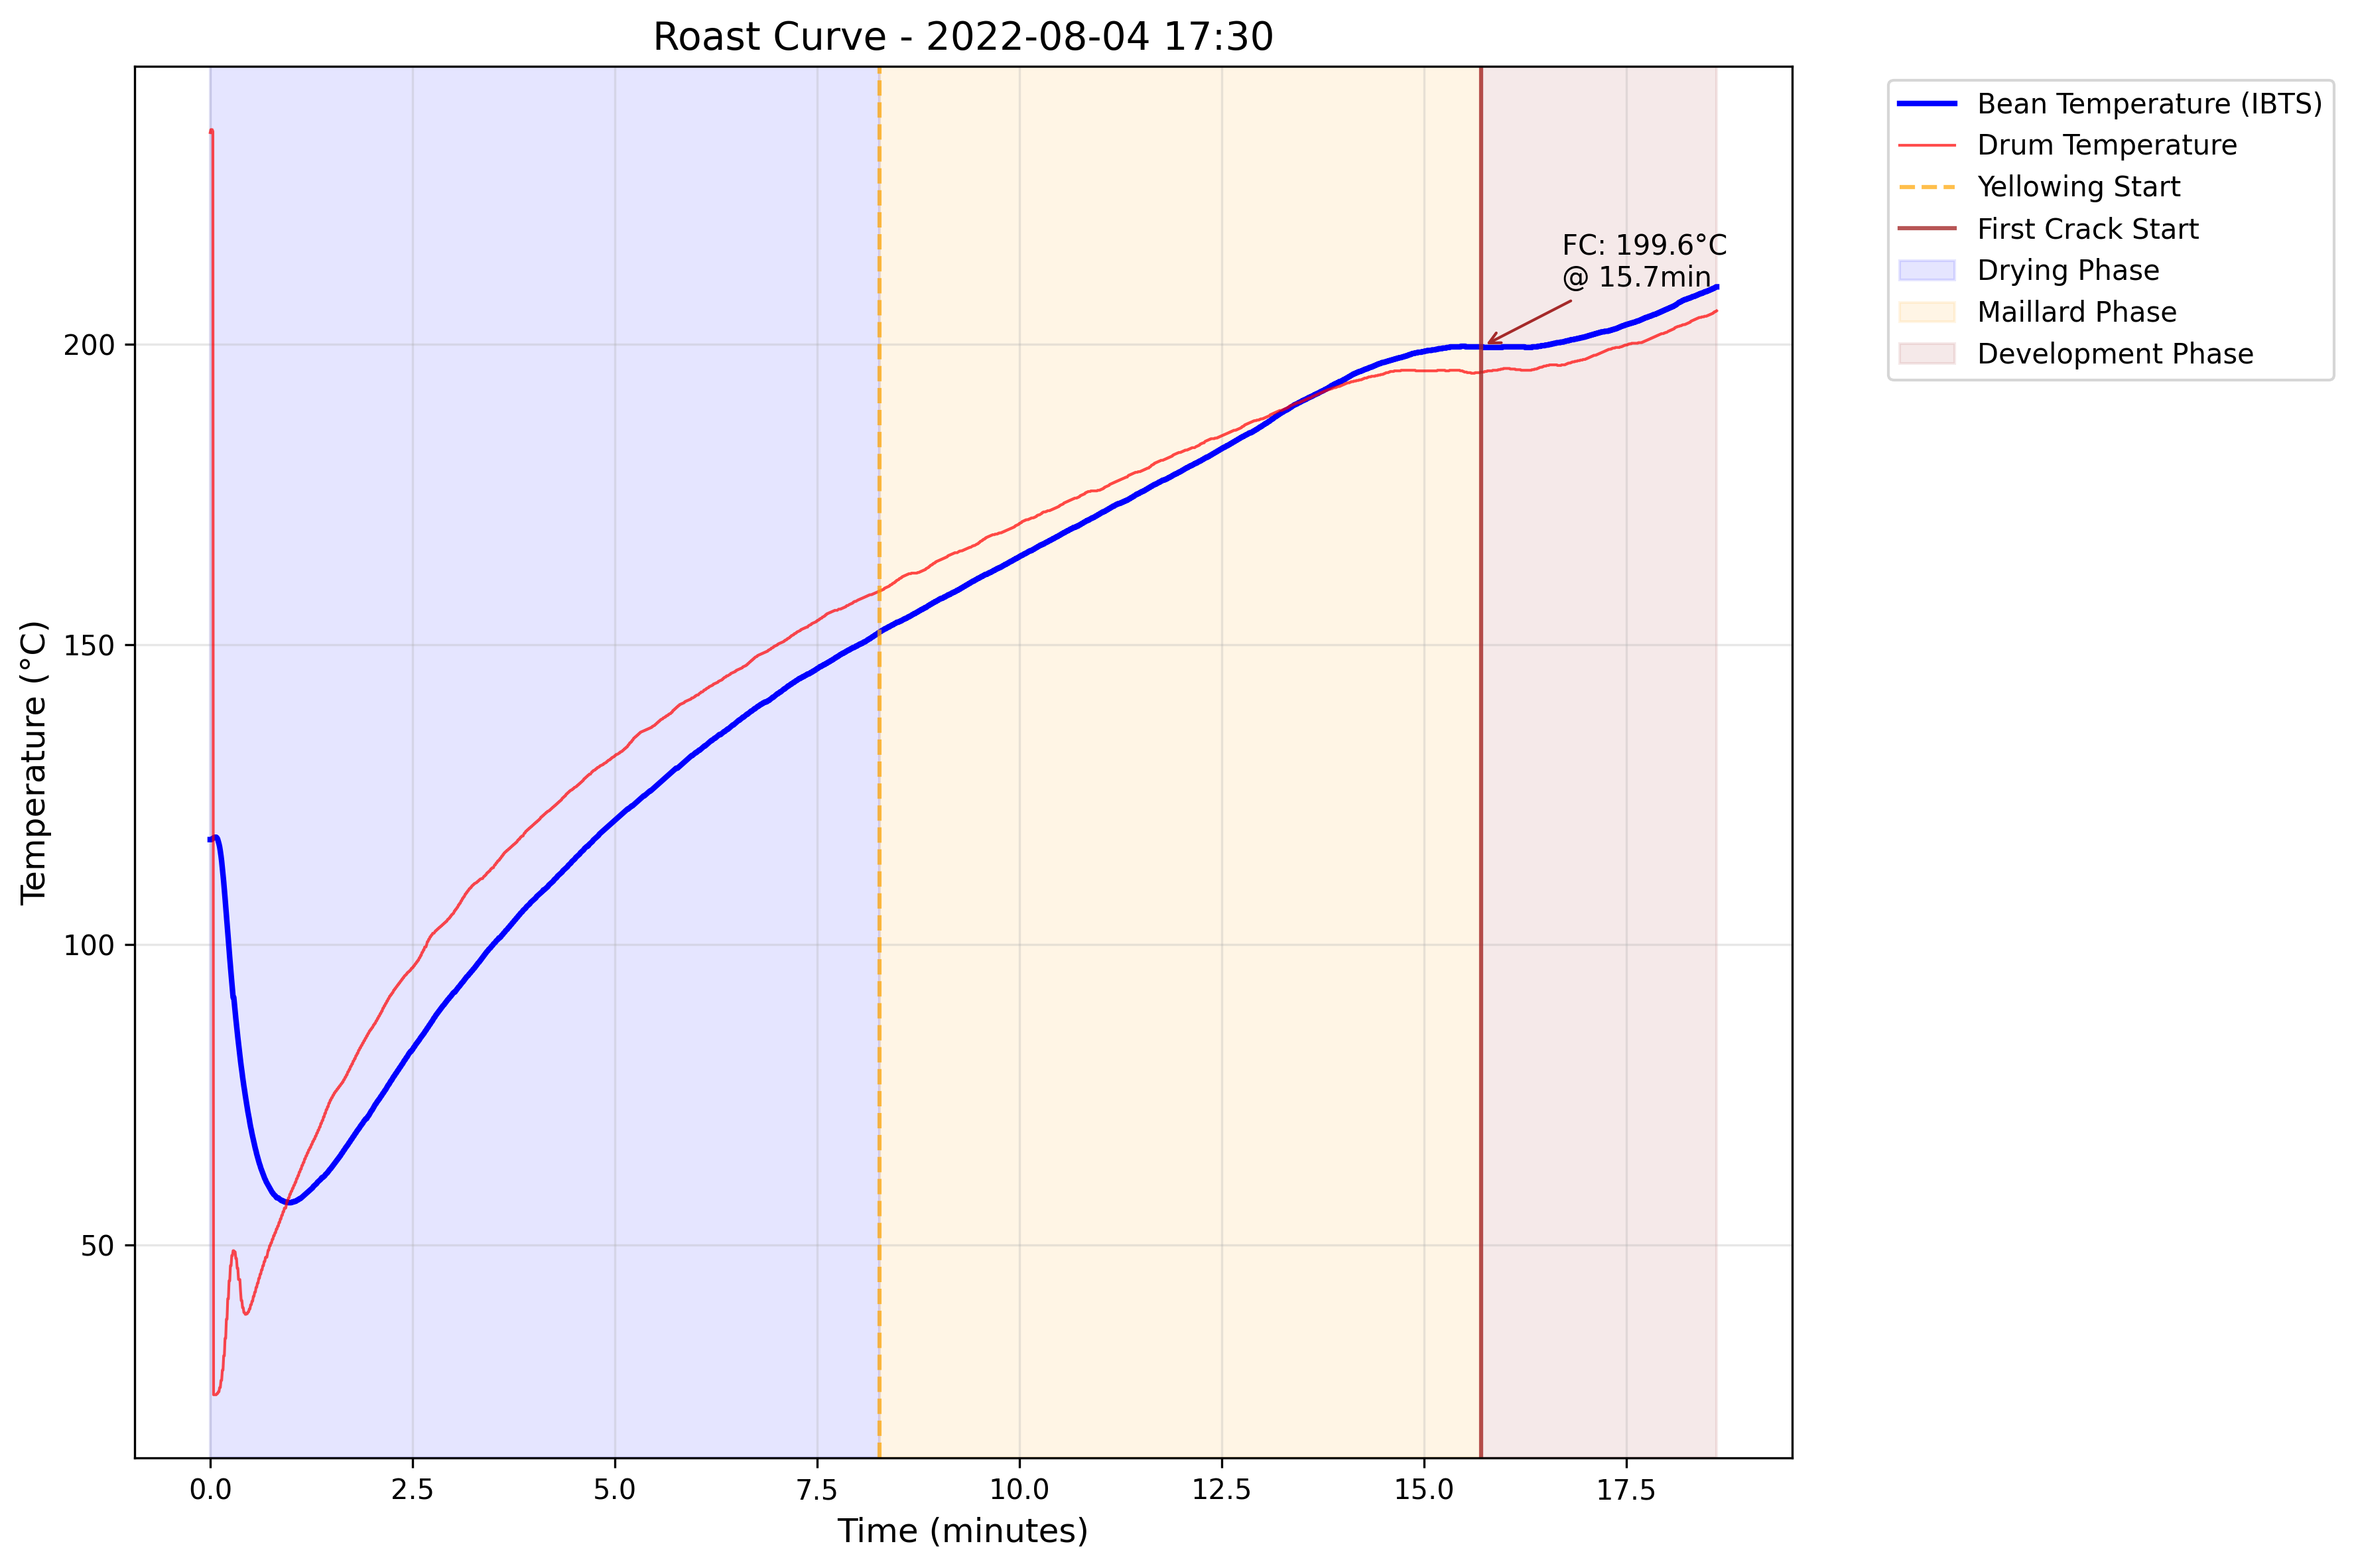
Roast curve from 4 August 2022, showing temperature progression and the key phase markers including yellowing
The blue line is bean temperature over time. The vertical lines mark the transitions.
Phase 1: drying (0 to 8:16)
In this roast: 0 to 8:16, 45% of total time
What’s happening:
- Moisture evaporates out of the green bean
- Colour shifts from green to pale yellow
- The reaction is endothermic, so the bean is absorbing heat
- Temperature climbs gradually while water is still boiling off
On the curve: the light blue shaded area, ending at the yellowing marker.
Why it matters: drying sets up everything after it. Too fast and the outside runs ahead of the inside, which produces uneven development. Too slow and you get baked flavours. We aim for this phase to take about 40-50% of total roast time.
Phase 2: Maillard (8:16 to 15:42)
In this roast: 8:16 to 15:42, 40% of total time
What’s happening:
- Maillard reactions begin and the bean starts browning
- Colour moves from yellow to light brown
- Flavour compounds develop in quantity
- Still endothermic, but the reactions are accelerating
On the curve: the orange shaded area, from the yellowing marker to first crack.
Why it matters: this is where most of the coffee’s flavour is built. The Maillard reactions produce hundreds of aromatic compounds. Enough time here gives body and sweetness; too much starts flattening origin character.
Phase 3: development (15:42 to 18:35)
In this roast: 15:42 to 18:35, 15.5% of total time
What’s happening:
- First crack begins, audibly
- Beans expand and lose more moisture
- Reactions turn exothermic and the bean starts producing its own heat
- Colour deepens toward the target roast level
On the curve: the brown shaded area from first crack to drop, where the rate of rise typically slows.
Why it matters: this is where the final character gets set. Too short and the cup is underdeveloped and sour. Too long and origin character burns off into generic roastiness.
Stopping before second crack
The decision that matters most is when to stop. Many roasters push through to second crack for darker roasts. We aim to bring the coffee to the brink of second crack without going through, and we rarely go through: 4 batches out of 78 on the standard profile.
Why
Origin character. Second crack begins around 225-235°C, and past that point roast flavours dominate whatever the coffee brought with it.
Sweetness. The late development phase is where sugars caramelise without burning.
Oil migration. Second crack is when oils reach the bean surface. That isn’t inherently a defect, but surface oil stales faster.
Reading the approach
The logger does record a second crack marker, and across our batches it has fired only a handful of times. Mostly you hear it coming.
Temperature: bean temperature into the 220-225°C range, rate of rise flattening, drum and bean temperature converging.
Sound: first crack finishes, then a quiet stretch before anything else starts.
Appearance: medium-brown colour, surface becoming more uniform.
Our target zone
Drop temperatures across our logged roasts span 191-241°C, with the middle half between 211 and 227°C:
- The low end is the earliest 2022 batches, which ran cooler throughout and recorded first crack as low as 183°C, well under the 195-202°C we see now
- The high end, 241°C, is one of the deliberate dark pair of July 2026. The hottest standard batch reached 237°C
- Longer developments run past 230°C, and a few of those do enter second crack
- Development ratios: 11-15% on these particular curves; nearer 20% across all logged batches
Why restraint is harder
Roasting to second crack is easy because second crack tells you when to stop. Stopping short means reading several indicators at once, knowing how a given origin behaves, and hitting the same window across coffees that behave differently.
When we go further
- Requests for darker roasts
- Origins that take more development well
- Experimental batches, to find where a coffee’s range ends
What it produces
Coffees with acidity present but not dominant, origin character intact, and sweetness developed without roast flavour on top.
Consistency across batches
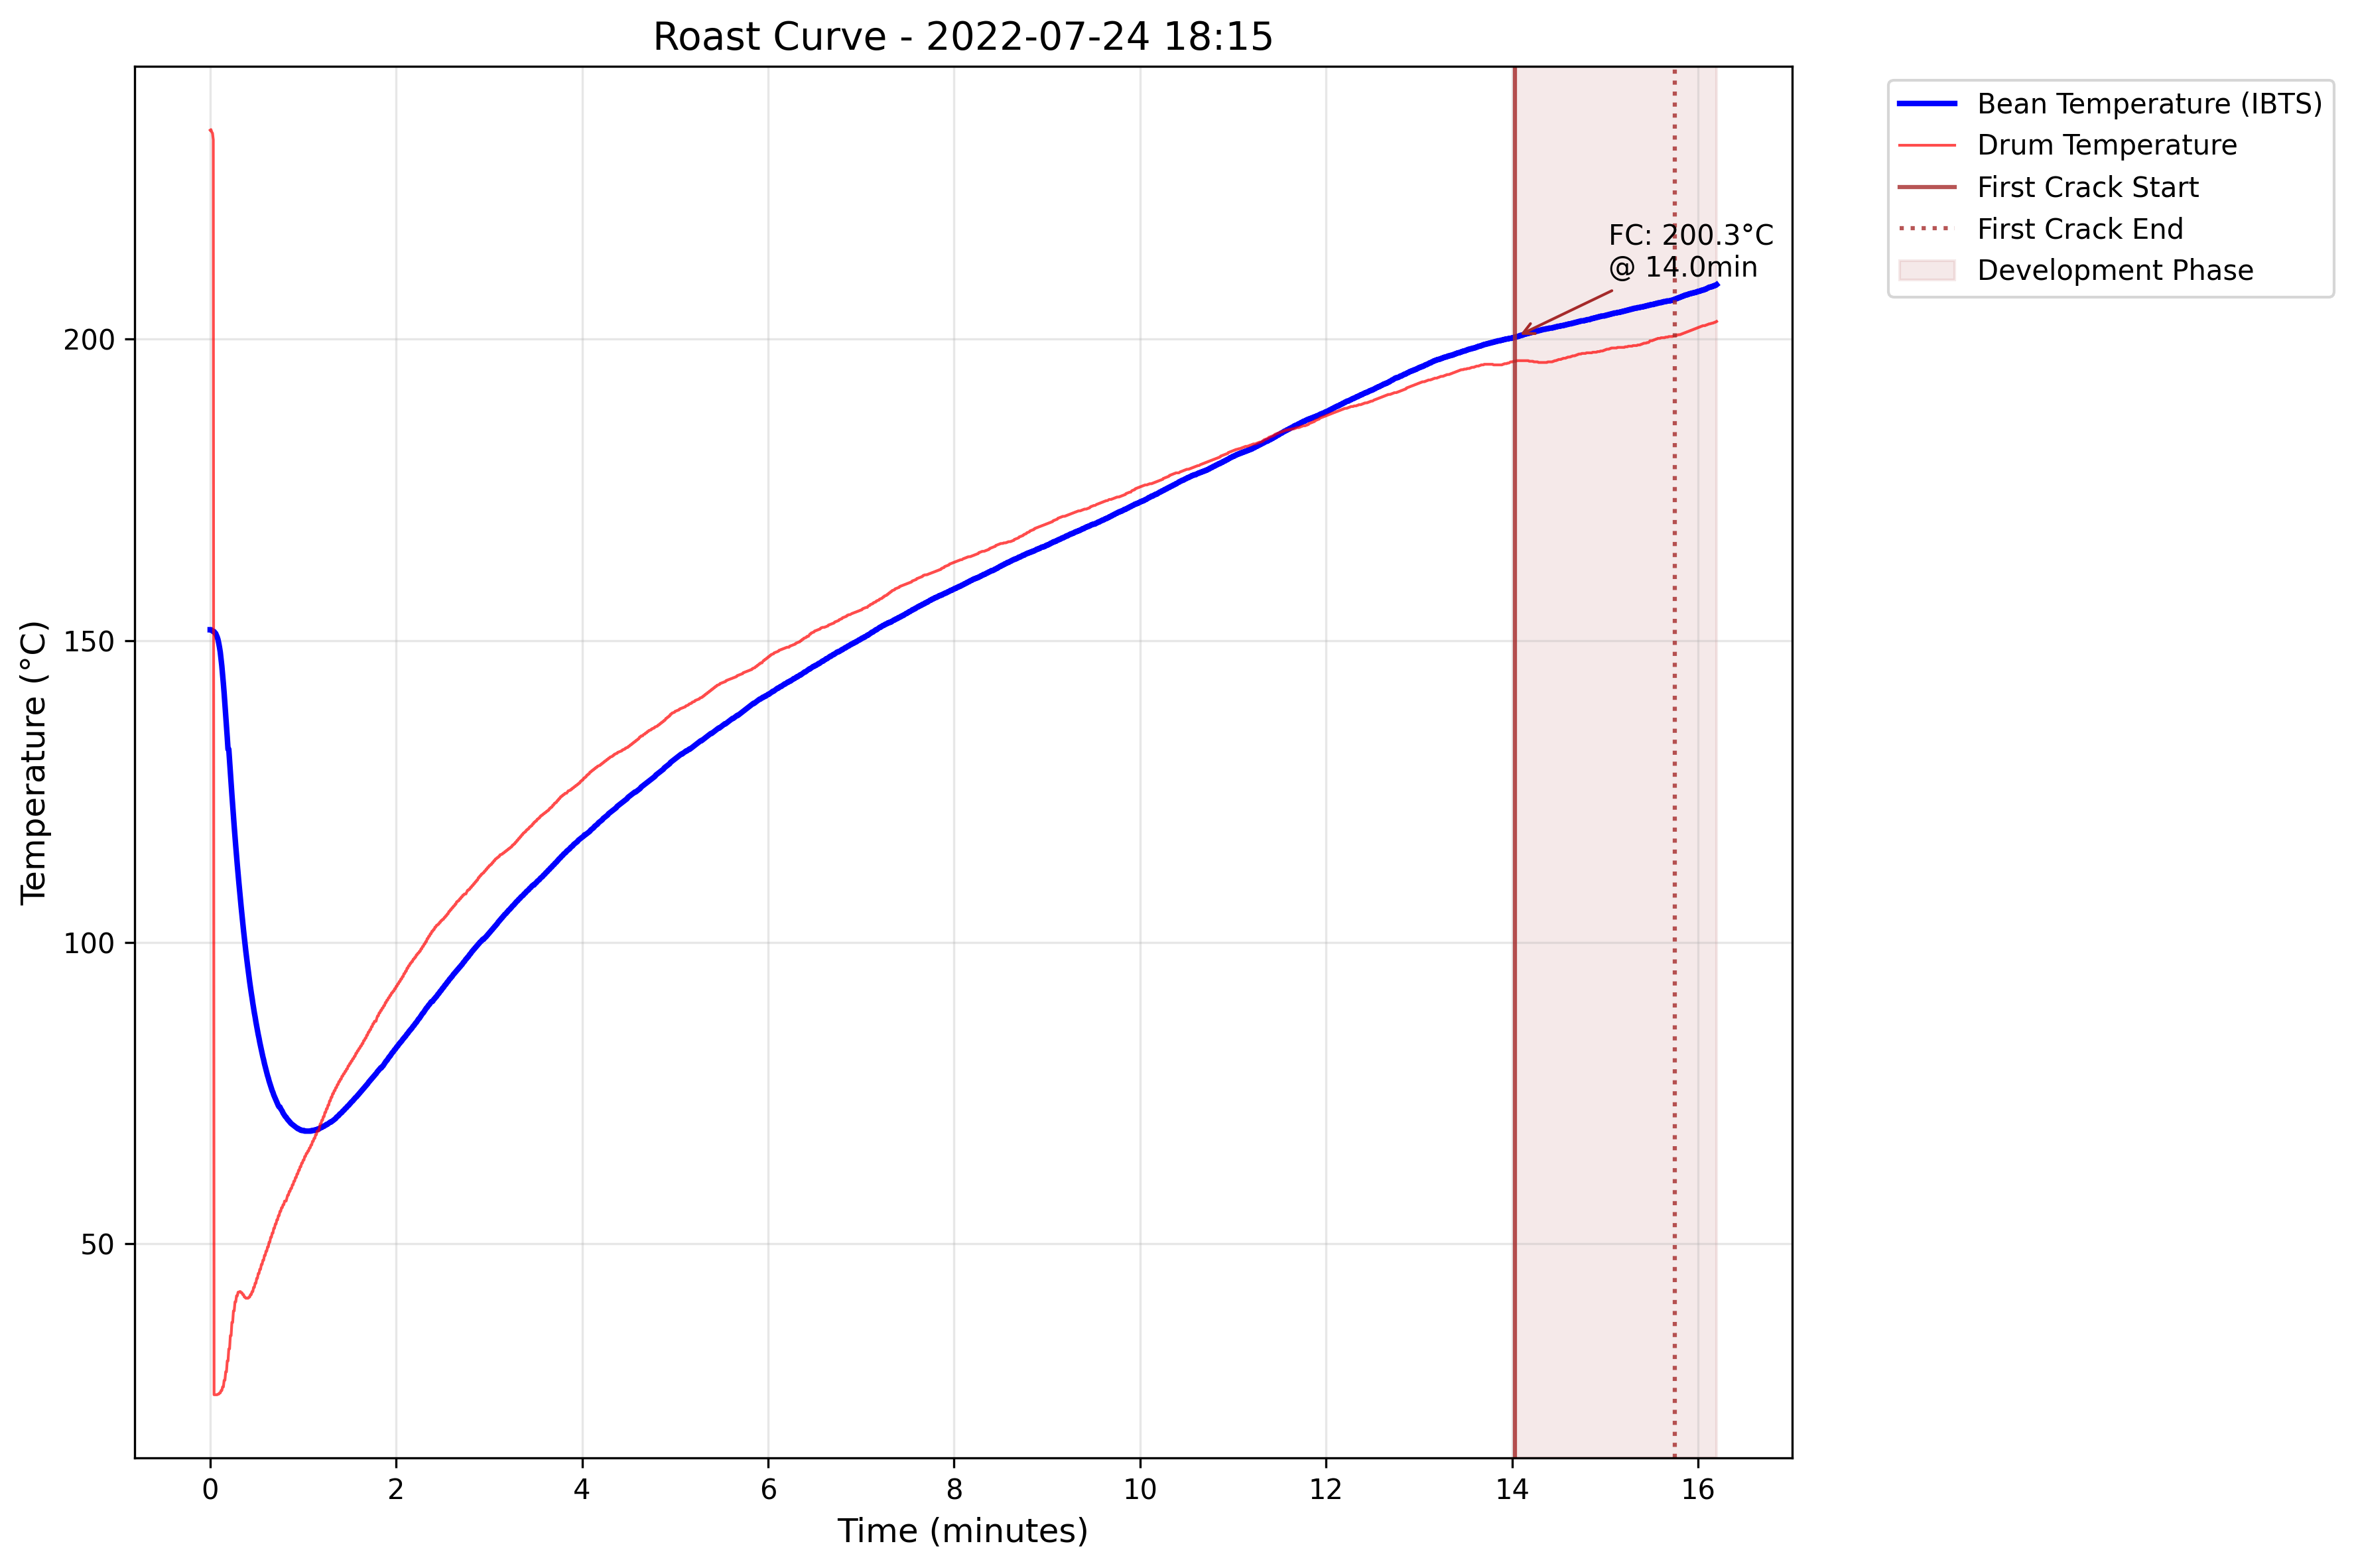
Comparison roast from 24 July 2022
Roast 1, 31 July 2022 (17:13 total):
- To first crack: 14:49
- Development: 2:23 (13.9%)
- First crack at 202.6°C, dropped at 212.3°C
Roast 2, 24 July 2022 (16:10 total):
- To first crack: 14:02
- Development: 2:08 (13.2%)
- First crack at 200.3°C, dropped at 209.0°C
The two track each other closely, which is the point of showing them. Both sit at the light end of what we do. Measured across all 80 batches in our logs the median development ratio is nearer 20%, so treat these as one end of the range rather than the house standard. The Roasting page has the full figures.
Key temperature markers
Charge (150-160°C). Where the beans go in. Sets how much heat is available early.
First crack (median 199°C, most batches 195-202°C). The transition into development, and the one marker you can confirm by ear.
Drop (209-215°C on these curves, median 224°C across all our batches). Determines final roast level.
Rate of rise
Rate of rise, how fast bean temperature is climbing, isn’t drawn on these simplified curves but it’s the thing you actually steer:
- Early: should decline gradually
- At first crack: often flattens or dips
- Through development: steady and controlled to the drop
Troubleshooting with curves
Flick (rate of rise rebounding upward): usually overcorrecting after a crash.
Crash (rate of rise falling off sharply): often the exothermic turn at first crack outrunning the heat you left in the drum.
Flat curve: underdevelopment.
Steep curve: risk of tipping or scorching.
Where judgement comes in
The curves cover most of it, but each origin needs adjustment. Dense high-altitude beans may need longer development. Natural process coffees often want shorter. Experimental processing sometimes needs an approach built from scratch.
Applying it
Home roasters: focus on phase ratios rather than exact temperatures, listen for first crack, and log the roasts that worked so you can repeat them.
Professionals: use curves to hold consistency across roasters and operators, document profiles for repeatability, and check feedback against the curve data.
Conclusion
Every roaster and every coffee is different, but the phases are the same everywhere. Build an approach you can repeat, then adjust it in small steps for the specific coffee.
Questions about roasting science? Contact us
All roast curves generated from RoasTime data using our Aillio Bullet R1.