The craft
Roasting
What happens inside the drum, why we publish our roast curves, and what 80 logged batches say about the profile we run.
“Medium roast” is close to meaningless. It describes a colour, and colour is the thing about a roast that tells you least. Two batches can finish at identical surface colour and taste nothing alike, because what matters is the path the bean took to get there and how long it spent in each stage.
A roast curve carries that information. So we publish ours, along with the aggregate numbers from every batch we have logged.
The three phases
Every roast runs through the same three stages. The art is in how long each one gets and how the heat is applied through them.
Drying: the first half
Green coffee arrives at around 10–12% moisture. Almost nothing interesting can happen until most of that has gone, because water boiling off holds the bean near 100 °C and caps the temperature. This phase is endothermic. The bean absorbs energy and gives back very little.
It ends at yellowing, when the bean shifts from green to pale straw and starts smelling like toast or hay instead of grass. On our batches that lands around the 7 to 8 minute mark.
Rush this phase and the outside dries well ahead of the inside. You end up with a bean scorched at the surface and underdeveloped at the core, a defect called tipping or facing depending on how it presents, and it isn’t recoverable later.
Maillard: the middle
With the water gone the bean temperature climbs freely, and the reactions that create flavour begin. Amino acids and reducing sugars combine into hundreds of aromatic compounds; caramelisation of the sugars runs alongside. This is where a coffee’s sweetness and body are built.
Length here is a real lever. A longer Maillard phase generally means more body and more caramel sweetness, at some cost to the sharp aromatic top notes. A short one keeps a coffee bright and floral but can leave it thin.
Development: after first crack
First crack is audible and unmistakable: steam and CO₂ build up until the bean’s structure fails and it cracks open, roughly like popcorn. Across our logs it lands at a median of 199 °C, with most batches between 195 and 202 °C.
Everything after first crack is the development phase, and it’s where most of the decisions that separate a good roast from a bad one get made. Too short and the cup is grassy, sour, and hollow, an underdeveloped roast, which is the most common fault in the current fashion for very light coffee. Too long and origin character burns off into generic roastiness.
Second crack, if you keep going, is the cell walls fracturing and oils migrating to the surface. We rarely go there: 4 batches out of 78 on our standard profile. Past that point you’re tasting the roast rather than the coffee.
Development ratio
The number we manage to:
Development ratio = time from first crack to drop ÷ total roast time
Across 78 logged batches on our standard profile the median is 20.4%, with half of all batches falling between 15% and 23%. The full range runs wider, 6% to 29%, and the tails are mostly early batches from 2022 where we were still finding the profile.
Below about 12% we consistently taste underdevelopment, that hay-and-sour signature no brewing adjustment fixes. Above roughly 25% the origin character starts flattening out.
It’s a guide rather than a law. Density, moisture content, and processing all shift where a given coffee wants to land, and a high-grown washed Ethiopian behaves quite differently from a natural at the same ratio.
Our curves
These are real batches off our roaster, plotted from the logger. Bean temperature climbs across the batch, the drum temperature runs alongside it, and the shaded bands mark the three phases.
A standard batch
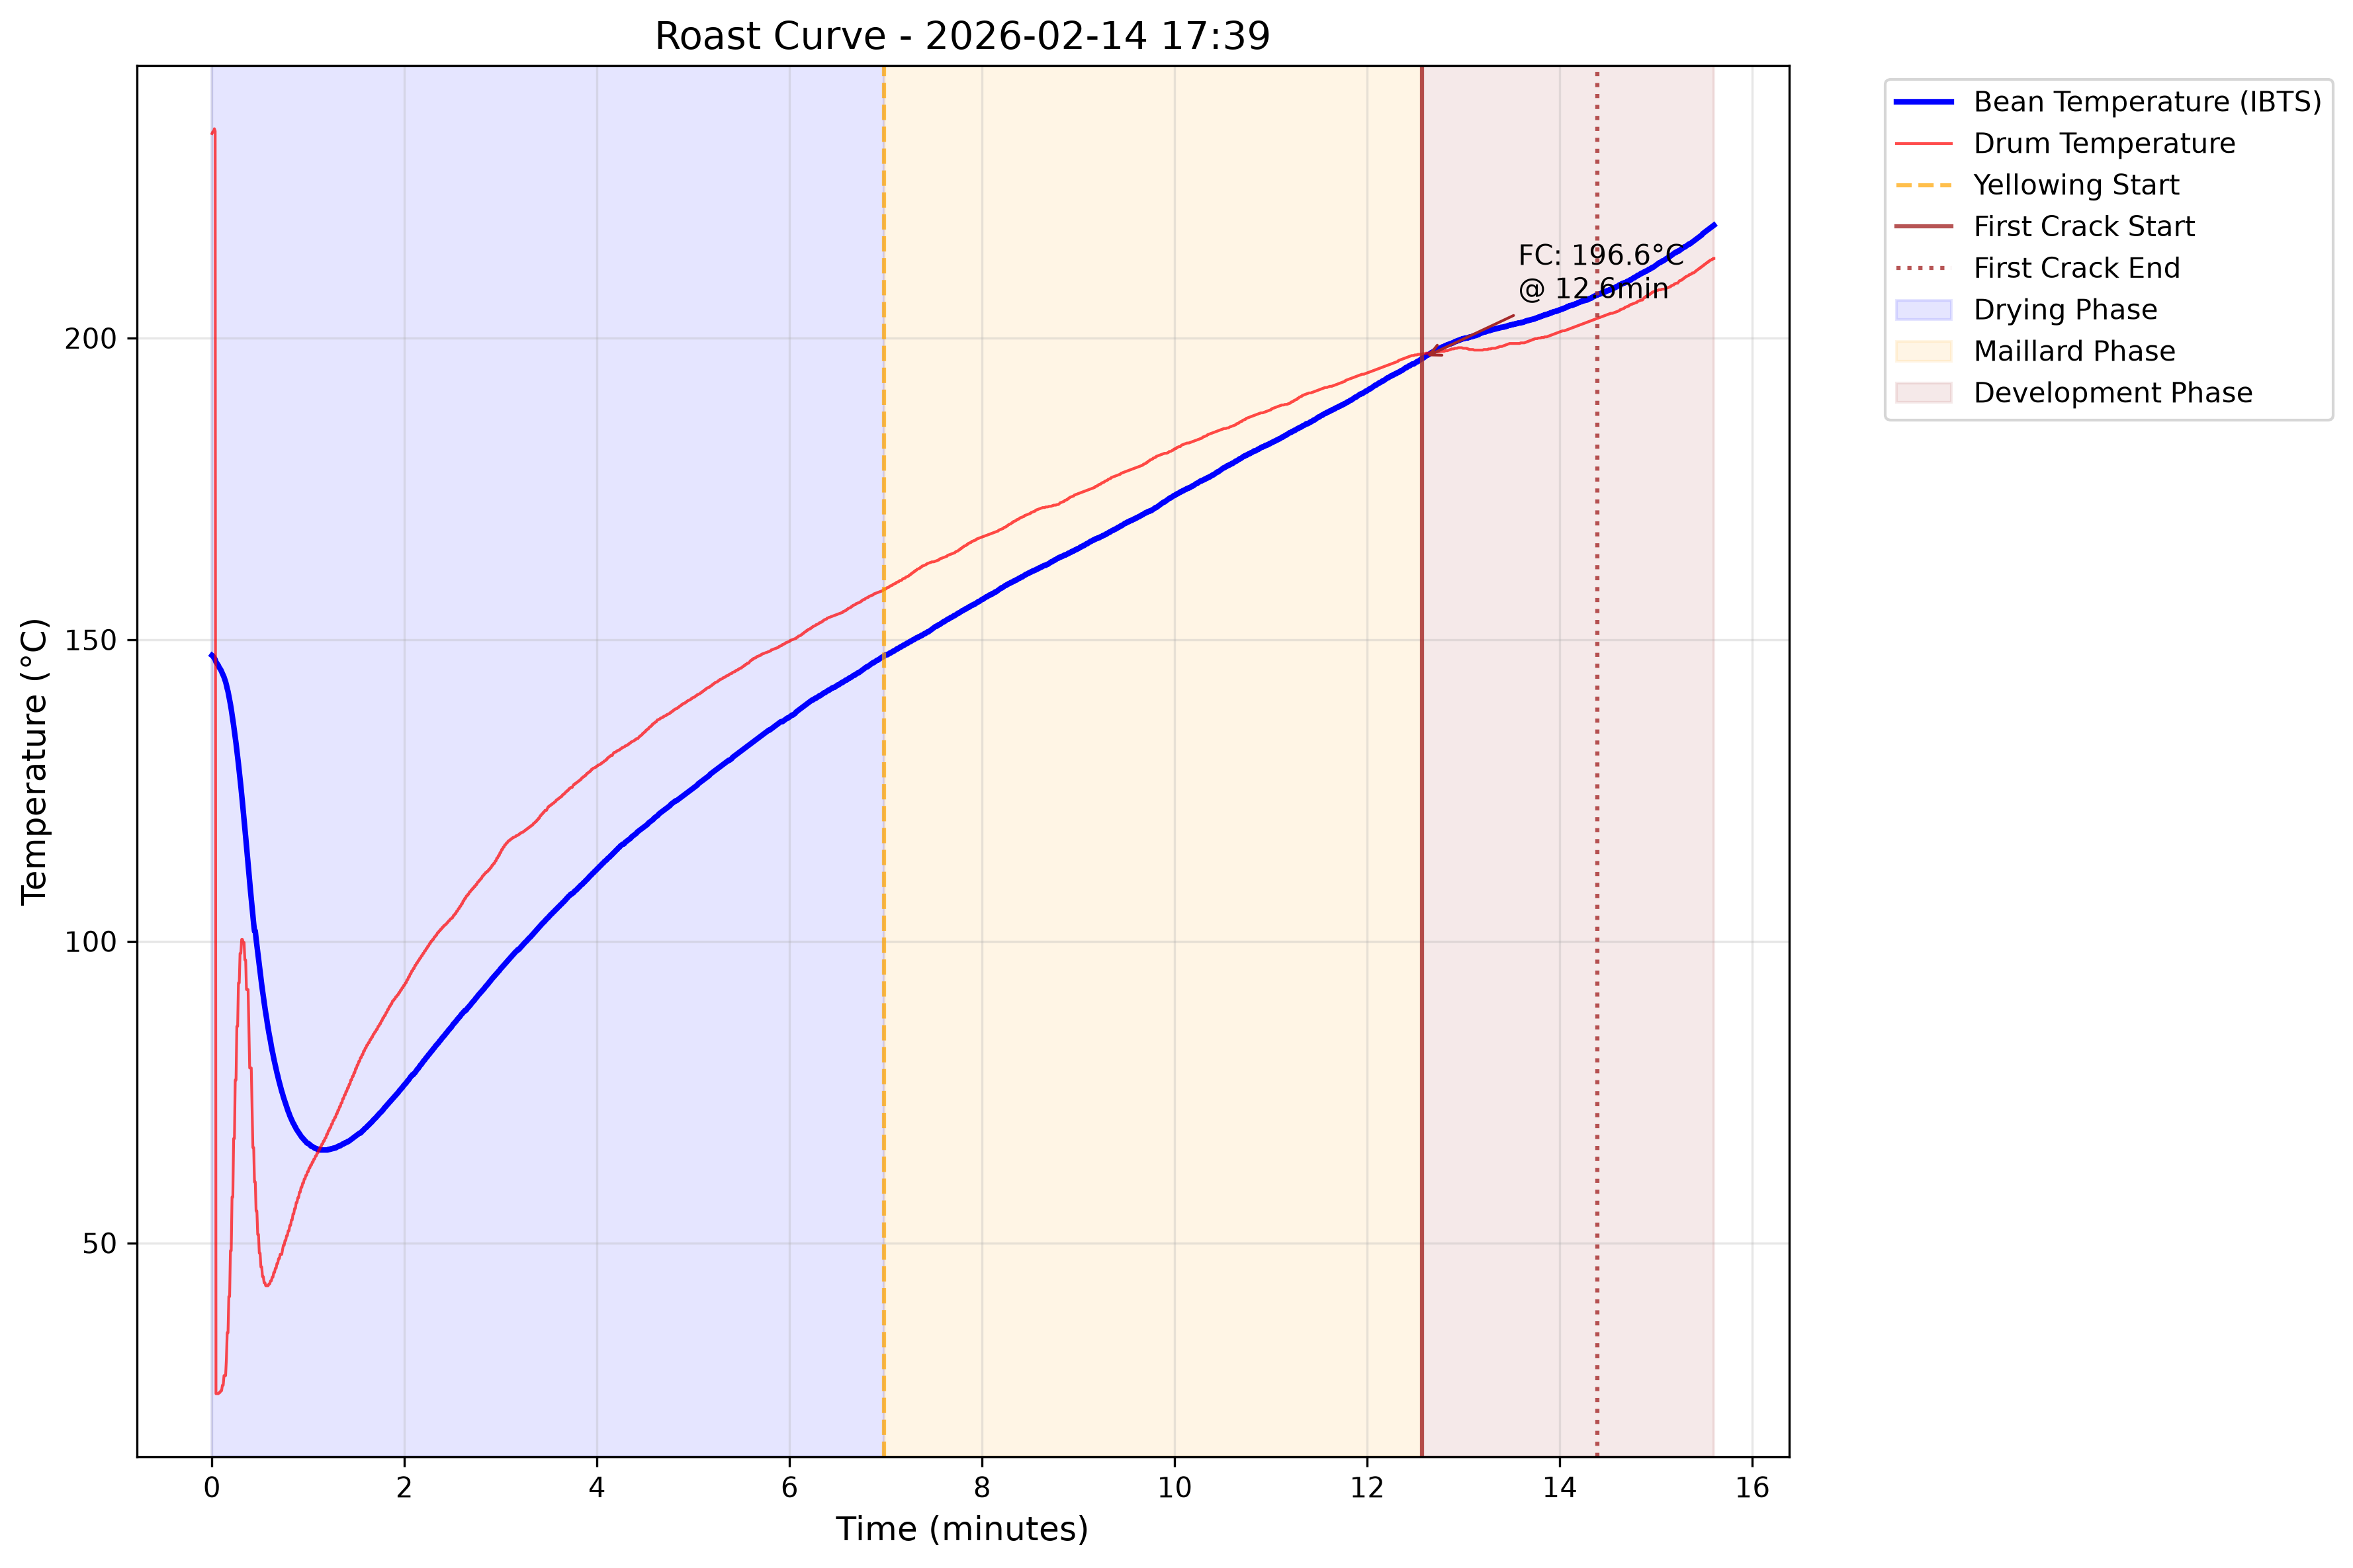
This is the shape we aim for. Yellowing a little before the halfway mark, a long steady climb through Maillard, and three minutes of development after first crack.
A deliberately darker batch
Not everything we roast is aimed at the same place. The batch below was taken deliberately darker, and it shows what that costs and buys.
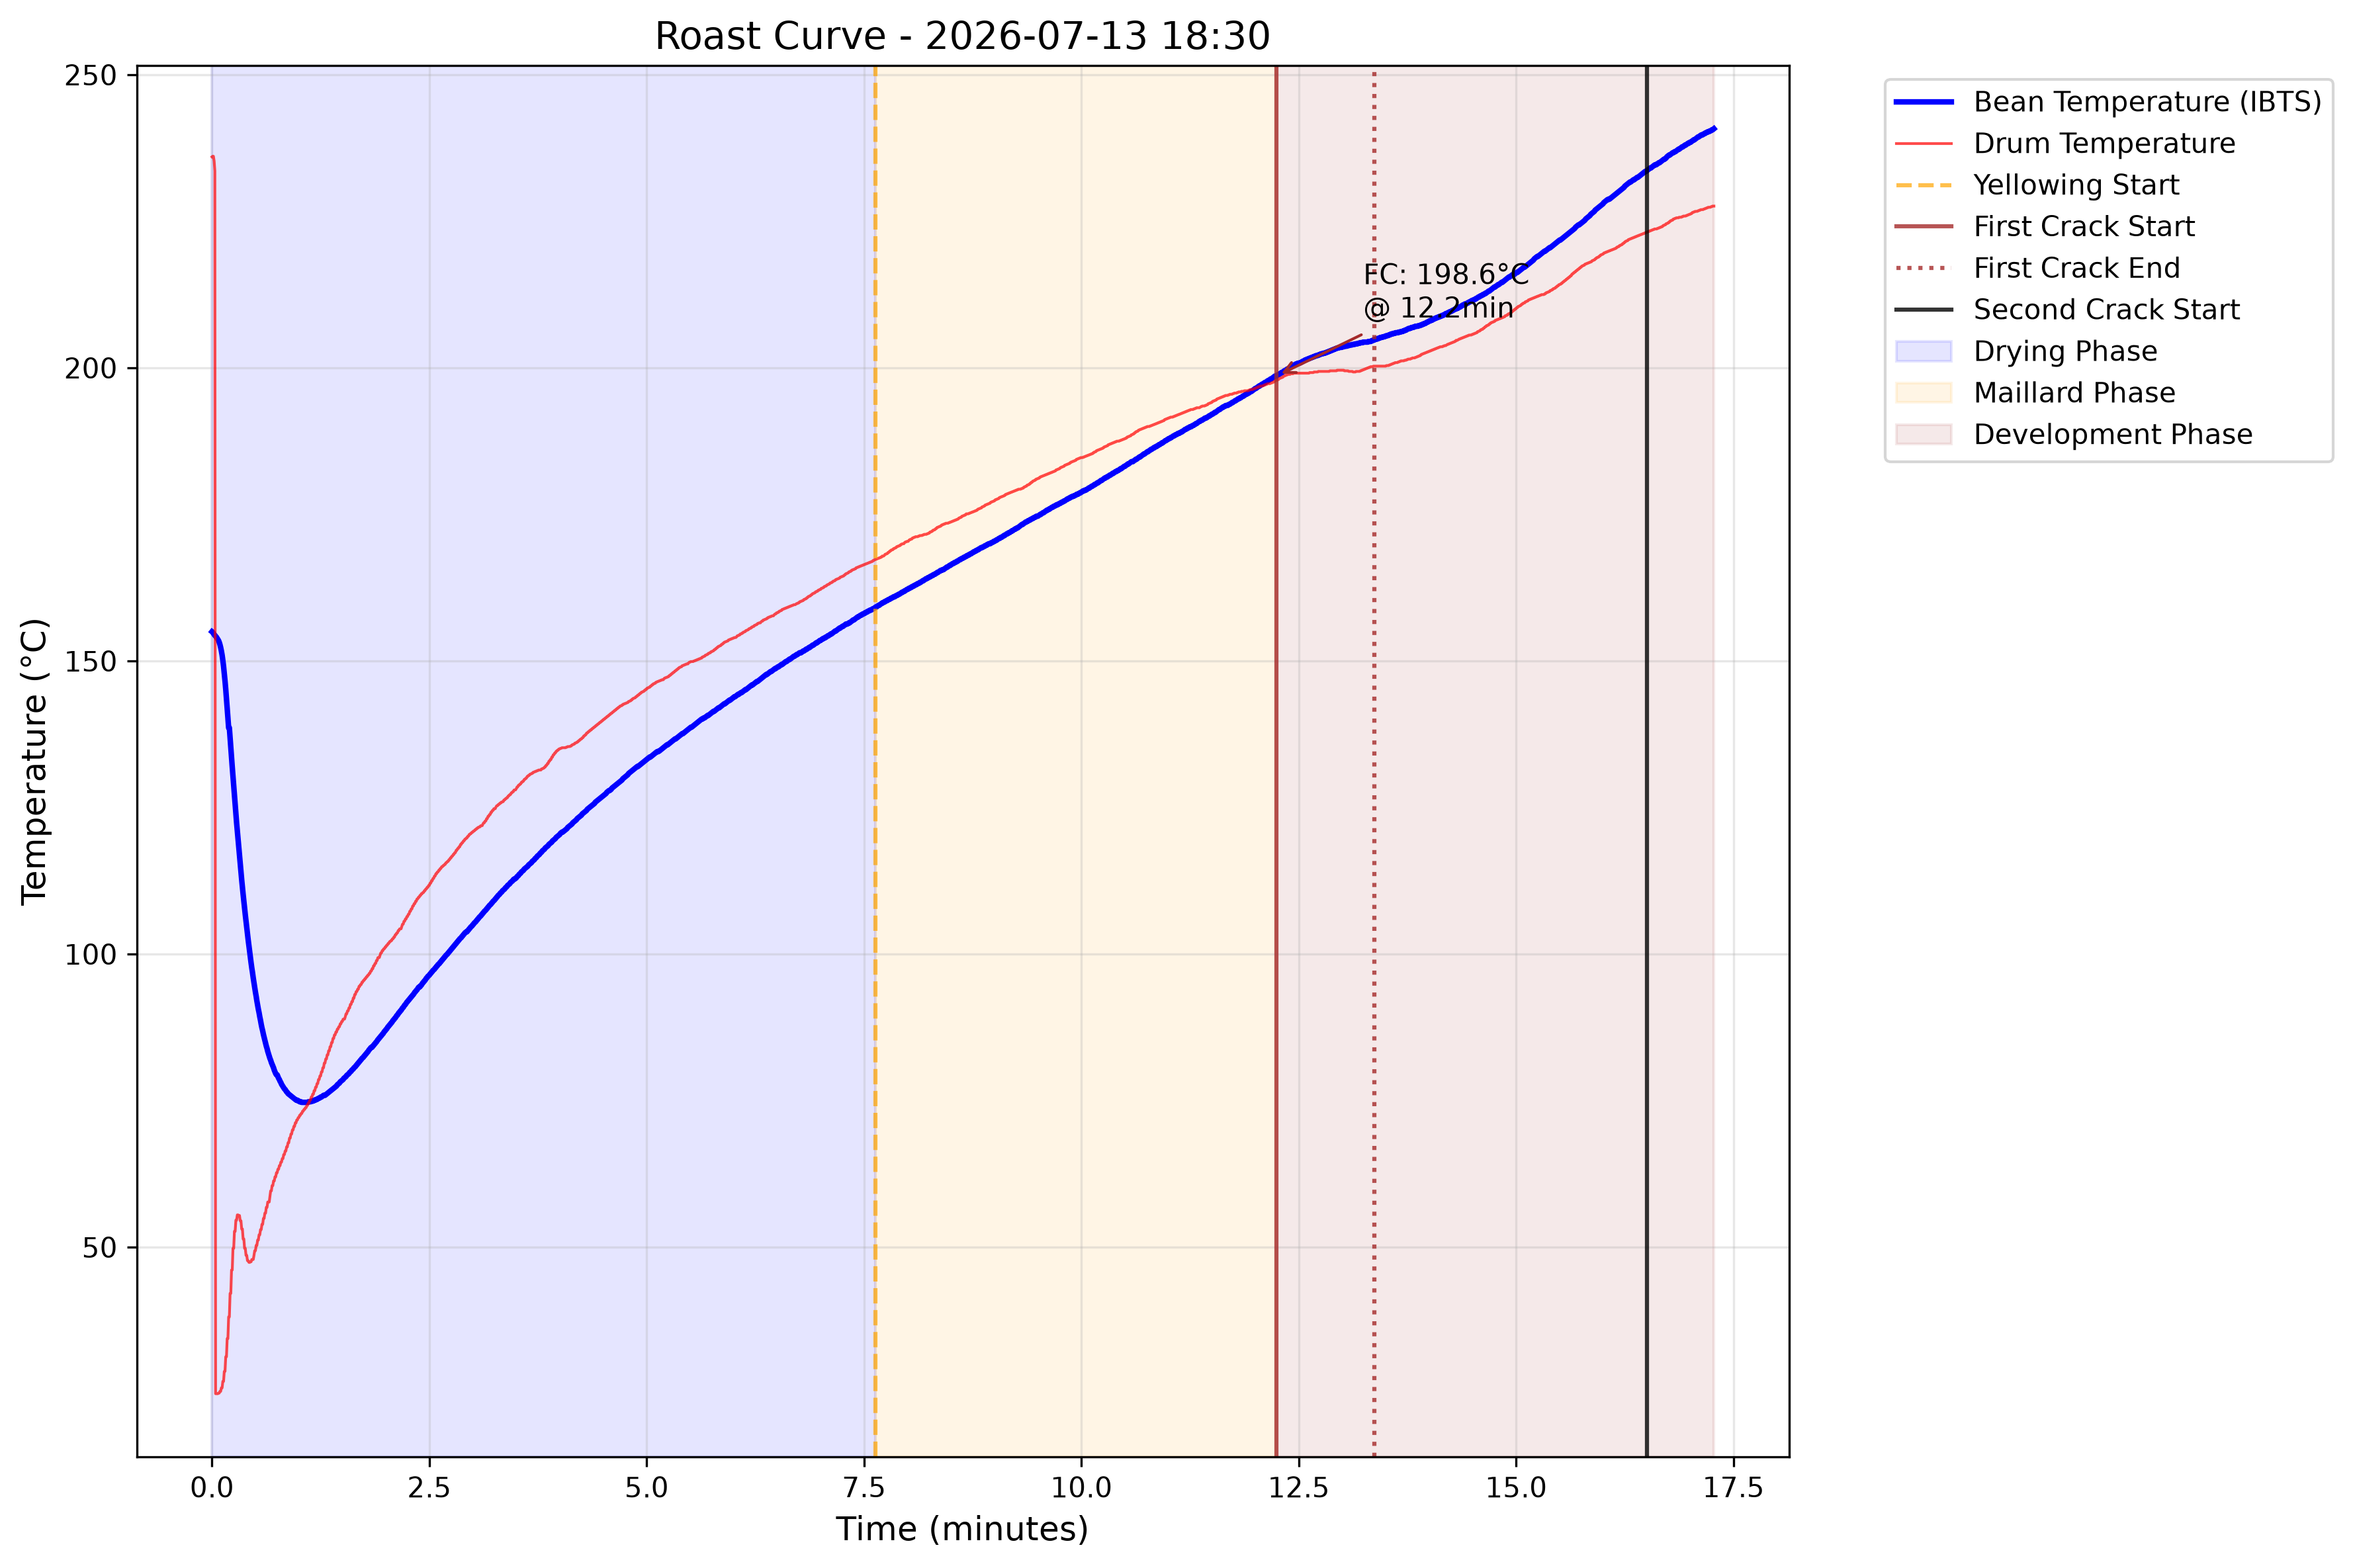
Compared with the February batch: ninety seconds longer overall, two extra minutes of development, and a drop temperature more than twenty degrees higher. Origin character gives way to roast character. For a coffee whose strengths are body and chocolate that’s the right trade. For a Gesha it would be vandalism.
Publishing both is the point. A roaster who only shows you their tidiest curve is showing you a marketing asset, not data.
What the logs say
Pulling all 80 logged batches together:
- First crack at a median of 199 °C, most batches 195–202 °C
- Development ratio median 20.6% across all 80, 20.4% over the 78 standard batches once the deliberate darks are set aside; middle half 15–23% either way
- Drop temperature median 224 °C, middle half 211–227 °C, varying with intent: 2022 batches cluster near 212 °C, 2023 to 2025 near 225–229 °C, 2026 standard batches median 225 °C across a wide 211–237 °C spread, and the deliberate July 2026 dark pair at 235–241 °C
- Total roast time mostly 14 to 17 minutes
- Second crack reached in 4 of 78 standard batches, and in both of the deliberately dark ones
The rate of rise should decline steadily and never cross back upward. That last point is the one roasters argue about most. A crash, where rate of rise falls off a cliff, usually just after first crack when the bean turns exothermic, followed by a flick back upward, is widely blamed for baked, flat cups. Keeping the decline smooth and monotonic is most of the job.
What we don’t do
- Blend. Every batch is one lot. See Origins.
- Roast to a colour target. We roast to a time-and-temperature profile and cup the result.
- Roast dark to cover defects. Dark roasting is a legitimate choice for a coffee whose strengths are body and chocolate, as the July batch above shows. It’s also the standard way to hide cheap green, and those two uses are easy to tell apart in the cup.
- Roast ahead. Coffee ships within a few days of the roast date, because the useful window is short and there’s no reason to spend it in a warehouse.
If you roast and want to compare notes on profiles or logging setups, get in touch . That’s a conversation we always have time for.